A few weeks back, as the #SAmbti hashtag became a Twitter discussion point, I surveyed the folks of the #SAchat community regarding their Myers-Briggs preferences. The Myers-Briggs Type Indicator® (MBTI®) is the most common instrument for determining psychological type preferences utilized in business, personal coaching and higher education. It asks a series of self-report forced-choice questions to define opposing preferences for personal energy, acquiring information, making decisions, and organizing one’s world.
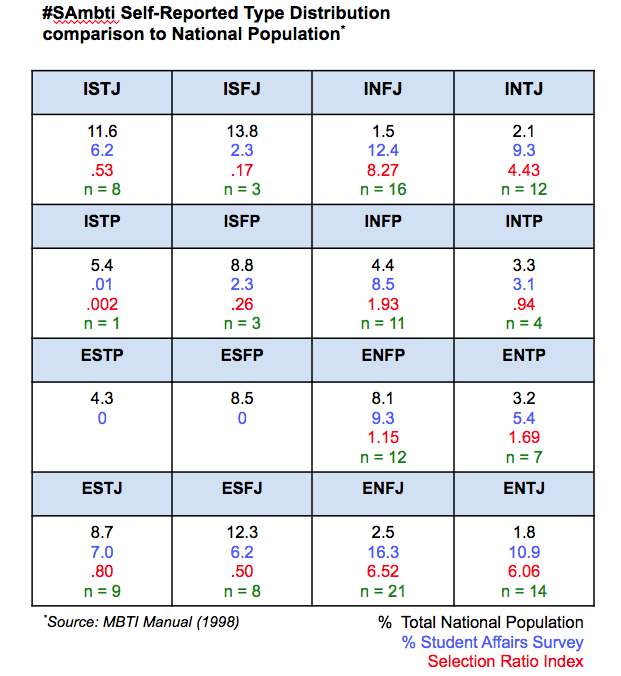
The survey produced the type preferences of 129 student affairs colleagues. More than half of those responding were female. Residence Life was the most common area of employment in student affairs. The most frequent type preferences were ENFJ (n = 21), INFJ (n = 16) and ENTJ (n = 14).
The primary method for analyzing type preferences is the self-selection ratio type table or SRTT (McCaulley, 1985). The SRTT is used to measure the frequency of type in a collected sample against the frequency of that type in a base population. SRTT determines the over- or under-representation of a research sample in comparison to a national base type preference sample. The ratio numerator represents the percentage of that type in the research sample while the denominator is the type percentage in the base population. The ratio is exactly 1.00 when the type percentage presented in a group is exactly the same as the proportion in the base population. It will be greater than 1.00 if the type is overrepresented and less than 1.00 when the type is underrepresented.
Each block in the 16 code type table contains the name of the type, the percentage of the base population or expected frequency for this type, and the percentage of the #SAmbti sample with preferences for this type. The SRTT index, or observed to expected frequency ratio for this type, is also included.
What do you see as you view this type table? As a type practitioner, I immediately note the weight on the right side of the type table. Of this survey of student affairs respondents, 75% prefer Intuition (N) as their perception function (second letter of MBTI type code), compared with 26.7% in the national sample population. Seven of the eight types preferring Intuition are over-represented in this survey sample. That is a lot of Intuition!
Intuition (N) as the perception function can be described as how one takes in information. It is similar to the sudden discovery of a pattern in unrelated events. People who prefer Intuition are comfortable with the big picture, brainstorming, and looking to the future. Intuitors are imaginative, abstract, original, and creative. They can also become so intent on possibilities that they overlook the details.
Do you prefer Intuition (N)? How is it useful to you in Student Affairs?

McCaulley, M. H. (1985). The selection ratio type table: A research strategy for comparing type distributions. Journal of Psychological Type, 10, 46-56.
Myers, I. B., McCaulley, M. H. Quenk, N. L., & Hammer, A. L. (1998). MBTI manual: A guide to the development and use of the Myers-Briggs Type Indicator. Palo Alto, CA: Consulting Psychologists Press.


